Home >
Blue watershed map
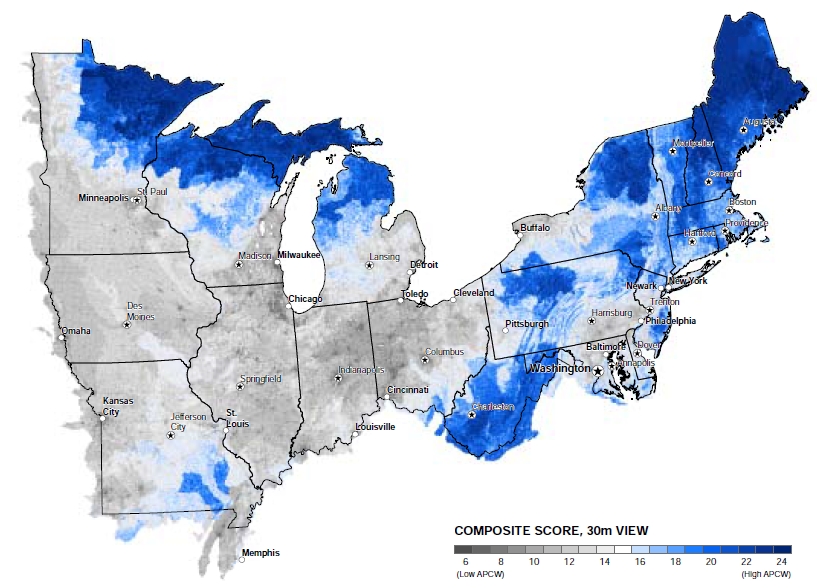
Index of the Ability to Produce Clean Water of areas across the Northeast and Midwest United States. Areas with higher scores, in darker shades of blue, have greater ability to produce clean water. Shades of gray indicate that intensive agriculture and impervious surfaces are likely to degrade water quality. From Barnes et al. (2009): Forests, Water and People: Drinking water supply and forest lands in the Northeast and Midwest United States.